
Want to learn how to create a Gantt chart in Jira? This guide has got you covered.
Gantt charts can help you, as a project manager, to effectively plan, schedule, and communicate your project’s timelines at the task and even sub-task level. As the most flexible and extensible work management tool out there, Jira allows you to create Gantt charts right from its dashboard. In this guide, we’ll walk you through how to do this.
To be specific, here’s what we’ll cover:
- What Gantt charts are.
- Gantt charts in Jira: How they differ from Timelines and Advanced Roadmaps.
- The prerequisites for creating a Gantt chart in Jira.
- A step-by-step guide for creating a Jira Gantt chart.
Straightaway, we’ll kick things off by first understanding what a Gantt chart is and why you might want to create one for your projects, stories, or epics in Jira.
What is a Gantt chart?
Jira is a great, if not the best, work management platform out there. However, understanding a project’s timeline at the task and sub-task level when you have a complex project in Jira can be extremely difficult. At the same time, tracing how they depend on each other, allocating resources, and monitoring them can be quite challenging.

Fortunately, you can create a Gantt chart in your Jira instance to consolidate all of this information on a single screen for better and easier planning. So what is a Gantt chart?
A Gantt chart is a bar chart containing an arrangement of tasks (and sub-tasks) against their timeline for completion. Gantt charts present a neat way for each project’s tasks to be completed in relation to their timelines. They comprise three parts:
- A list of tasks on the left.
- The dates or time periods (months, quarters, etc) at the top.
- A timeline with horizontal bars that illustrate when a project starts, ends, or overlaps.

With a Gantt chart, you’ll be able to visualize your projects’ timelines down to the sub-task level. You can see each task’s start and end dates, milestones, dependencies, assignees, etc.
As a product manager or supervisor, Gantt charts provide you with a visual birds-eye view of everything. You can quickly see if production schedules are behind, ahead, or on track.
On top of that, Gantt charts are powerful planning tools. You can use them to see how you’ve allocated resources across different tasks. This way, you’ll avoid overwhelming teams with more work than they can handle – which could lead to delays.

Boost your teams’ efficiency
Maximize your team’s productivity by easily duplicating your epics, tasks and stories with “Easy Issue Templates for Jira Issues”
Gantt charts in Agile work
We primarily associate Gantt charts with waterfall processes as opposed to agile work. This is because you can easily present the linear progression (one task must end before the other begins) in waterfall processes with the horizontal bars of a Gantt chart.
Seeing as agile work is more iterative, i.e., it has a cycle of repeated steps, how can agile teams use Gantt charts? First of all, organizations rarely use pure agile or waterfall methodology to execute projects. Usually, you’ll find teams using a hybrid of the two.
Secondly, dates are fluid with Agile, and it can be hard to communicate project timing to stakeholders. An agile Gantt chart allows you to add timelines to sprint cycles so you can easily update stakeholders on a project’s status.
Gantt charts apply a waterfall model to Agile projects by mapping sprint tasks and dependencies out on a visual timeline. This makes it easy to track progress, manage workloads, and keep stakeholders up to date.
Gantt charts in Jira: How they differ from Timelines and Advanced Roadmaps
As one of, if not the best Agile work management tools, does Jira have Gantt charts in the default setup? Yes, kind of. If you’re managing projects on this platform, you’ll come across Gantt charts in the:
- Jira Timeline view – This is Jira’s free Gantt chart option which you’ll find under the Jira project planning screen.
- Jira Roadmap view – Only available in the premium version of Jira Product Discovery.
You can use Jira’s Timelines even without purchasing a Jira license. However, when it comes to Gantt charts, the Timeline view is quite limited as it doesn’t show subtasks – just the epics.

While Jira’s Advanced Roadmaps offers more features such as showing sub-tasks, dependencies, milestones, etc., it falls short when it comes to:
- Creating baselines (a snapshot of the original project plan).
- Handling task delays.
- Viewing your project’s critical path.
- Advanced functionalities such as smart workload allocation and so on.
Also, its interface isn’t user-friendly, making creating Gantt charts more complex than it has to be. The bottom line is that you’ll need to look elsewhere if you want to get detailed with your Gantt chart and if you’re looking for an easy way to get it done. This is where Jira Gantt chart plugins come in. In this guide, we’ll walk you through how to create a Gantt chart in Jira using a plugin.
Let’s begin.
How to create a Gantt chart in Jira Step-by-Step
Before you start, here are a few things you’ll need:
- A valid Jira license and a ready-to-use Jira instance. If you want to take Jira Gantt charts for a test run, you can use the free version. Remember that you’ll be limited to 2GB of storage and up to 10 users with this version.
- The required permissions to create a Gantt chart, preferably a Jira instance admin.
- A project setup with issues, assignees, and due dates.
- A Gantt chart plugin.
Once all this is in place, you’re ready to start creating a Gantt chart.
Step 1: Install a Jira Gantt chart plugin
We’ve already established that you’ll need a Gantt chart plugin to create a comprehensive chart for your Jira projects. There are tons of Gantt chart projects in the Atlassian marketplace such as Big Gantt, Gantt charts for structure PPM, Visor, etc.In this guide, we’ll use the WBS Gantt Chart plugin, primarily because of its user-friendly Microsoft Excel-like interface.

It is incredibly easy to create and customize Gantt charts using this plugin. On top of that, it allows you to:
- Create dependencies with simple drag-and-drop. From these dependencies, you can visualize the critical path. These are the order in which tasks should be completed to prevent bottlenecks in the project.
- Create a baseline for all tasks in just two clicks. When you hover over the baseline, it displays a snapshot of the entire project.
- View how much of a workload is allocated to assignees. This allows you to distribute workload evenly across your teams.
When you want to share this Jira chart with stakeholders, WBS Gantt chart allows you to export it to Excel or MS Project. Now we know the tool to use, let’s install it and create a Gantt chart.
To install WBS Gantt chart:
- Log into your Jira account, click on the Apps tab at the top, and go to Explore more apps.

2. This will take you to the Atlassian Marketplace. Search for ‘WBS Gantt chart’ and click Try for free once it pops up. Jira will install this app for you (which only takes a few seconds) and then click on Get Started once this is done.

3. On the next screen, the plugin will walk you through a series of tutorials on how to configure a WBS Gantt chart. This includes things like restricting other users from creating Gantt charts, setting default date and time formats, etc.
Once this setup is done, you’re ready to create your first Gantt chart.
Step 2: Create your first Jira Gantt chart
The first thing you’ll need to do here is create a project from which WBS Gantt chart will generate a Gantt chart. To do this:
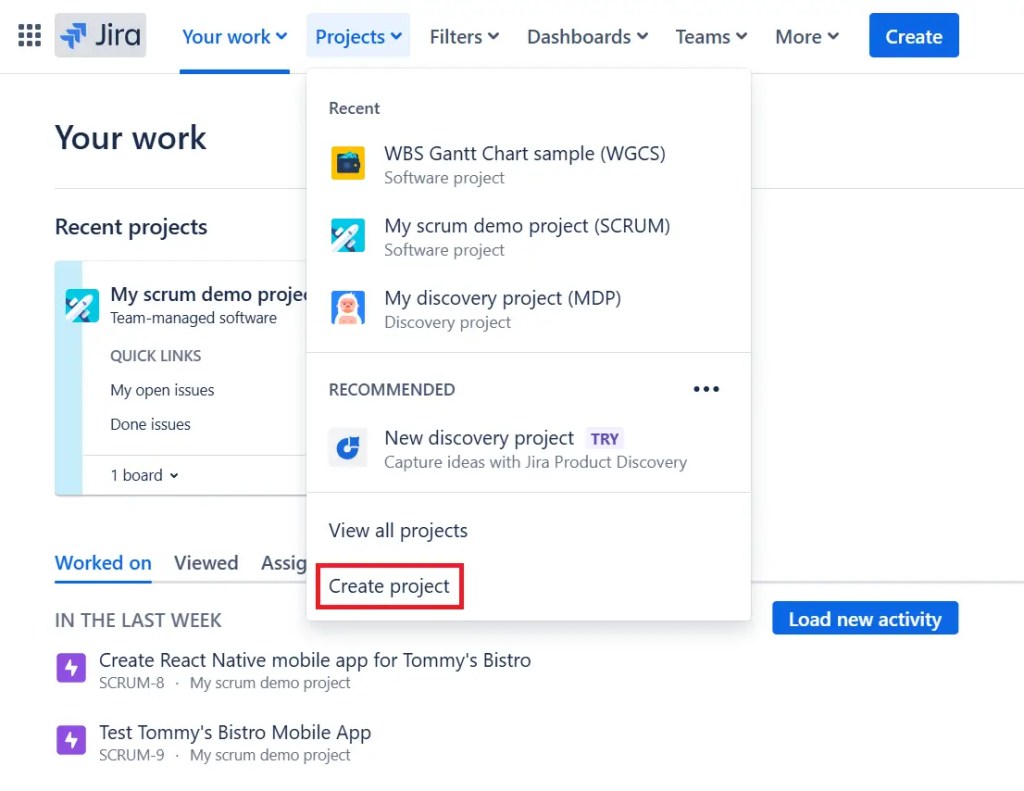
- From your Jira dashboard, click on the Projects dropdown and click on Create project.
2. Select a template for your project (Scrum/Kanban).
3. Add details such as the Name and Key.

NOTE: You can’t generate a Gantt chart from an existing project, you don’t have to create a new one. Also, you don’t have to add issues and assignees here, we’ll do it when creating the Gantt chart.
Go back to your Jira dashboard and click on Apps > WBS Gantt chart. Click on Create Gantt and then Create from Jira Projects.

Name the Gantt chart and select the project
Once this is done, WBS will create your Gantt chart, then you can go on to customize it.
Step 3: Customize your Gantt chart
The first step here is to add issues to your project. Click on the Plus (+) icon and select the type of issue you want to create.

Next, you’ll configure the following settings:
- Set the units – the percentage of the work the assignee allocates to the issue.
- Priority.
- Start and end dates.
- Duration – once you set the duration, the horizontal bars appear.

Once you set durations for all issues the bar chart will look something like this:

Create dependencies in your issues
You can create dependencies by simply clicking on the end of one bar, dragging the cursor, and dropping it at the end of another bar. After creating dependencies, click on the Eye icon and select Critical path to see which tasks need to be completed first.

Set the baseline
To set the baseline, click on the Edit button at the top and select All Child Issues. You’ll see a grey line below all issues.

This is what shows a snapshot of the entire project. That’s it, you’ve created your first Gantt chart. You can now click Save to save your progress. If you want to share it with stakeholders, click on the Spanner icon at the top and select the format in which you want to export your Gantt chart.

With your Gantt chart created, let’s put it to good use and interpret it.
Step 4: Interpret your Gantt chart
WBS Gantt chart has several viewing options that allow you to easily interpret your Gantt chart. You can use them to see if your project is on track, tasks in the critical path, how you’ve allocated resources, etc.
Track resource allocation
Using the resource view, you can check how much of a workload is allocated to an assignee. You can open the resource view by clicking on the View tab and checking the box that says resource view.

A bar chart showing the workload per assignee will appear below the Gantt chart. If the bars are green it means that the workload is within the limit or below it. The reverse is true if the bars are red.
Track your progress
To track your progress, you’ll also need to click the View tab and select the Progress line option. A line chart will appear inside your Gantt chart.

If the lines are protruding to the left it means there’s a delay in your progress. But if they’re protruding to the right, it means you’re ahead of your plans.
Understand start dates at a glance
On the left, you’ll see several warning icons, and here is what they mean. If the color is green it means the start date is approaching while if it’s yellow it means the issue didn’t start on the planned date. But if it’s red, it means it is off track.
So that’s everything you need to know to get started with Gantt charts. But this alone isn’t enough to create impactful Gantt charts. There are a set of best practices you’ll want to apply to get the best out of your Gantt charts.
Best practices for creating Gantt charts in Jira
Gantt charts are powerful project management tools in Jira, but only if they’re used correctly. So here are some tips for using Jira Gantt charts effectively.
Make use of labels to keep it simple
While a Gantt chart’s purpose is to make it easier to understand a project’s timelines at a glance, it can easily get complex. Especially when you don’t label it properly and when the bars look the same.

As a result, ensure you use clear labels (proper font sizes and colors) to make it easier to read. Also, use different colors for parent issues and child issues. To do this in WBS Gantt charts, go to Settings > Colors and edit the colors of the horizontal bars and baseline.
Include dependencies and milestones
If you want your stakeholders to understand how different tasks affect each other, you must include dependencies. Also, this helps your teams to complete tasks in the correct order. If the scope of your project is quite large, include milestones to keep teams motivated.
Update the chart regularly
Ensure to update the Gantt chart regularly to reflect any changes in scheduling. We know that in Agile, requirements change from time to time. If any changes occur, you should update the Gantt chart immediately. You should also do this when teams complete tasks or when a new task pops up.
Use the chart for communication
You can use the Gantt chart as a way to communicate the project’s progress with stakeholders. This is why it’s important to have a Gantt chart plugin that allows you to export your charts. Share this chart with stakeholders regularly so you can discuss any changes or issues that arise.
Summary and Key Takeaways
A Gantt chart for your projects is a must-have if you want to easily communicate their progress and timelines with stakeholders and your teams. Jira does have options for creating Gantt charts in the default setup. However, these options aren’t sufficient and fall short when it comes to breadth of features and ease of use.
This is where Gantt chart plugins like WBS Gantt chart come in handy. They provide a simple way to create, customize, and interpret Gantt charts. Once you’re done creating one, you can share it with stakeholders in a format of your choosing.

